Visualizing Pi: A Symphony of Digits
I’ve always believed that math isn’t just about numbers, it’s about stories. And few stories are as timeless, mysterious, and quietly poetic as that of π.
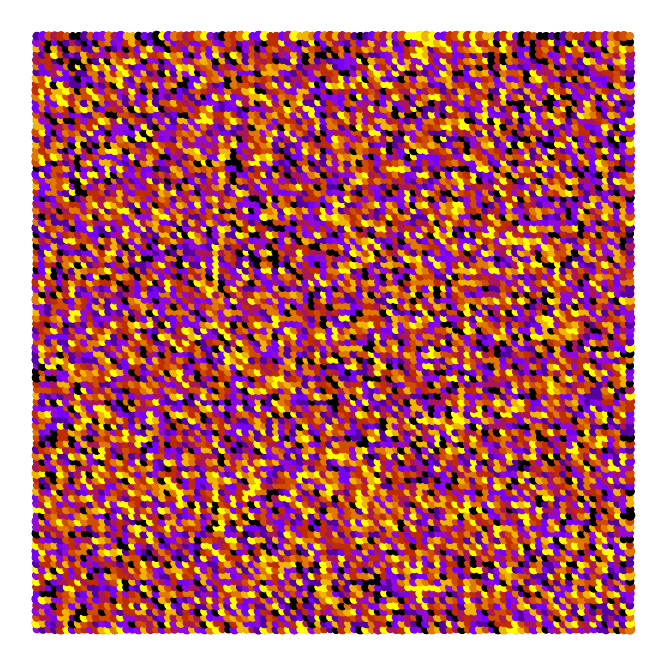
Yes, I know, Pi Day is on March 14th. But honestly? I couldn’t wait. So last week, I let my curiosity take the wheel and turned the first 10,000 digits of pi into something you can see, not just calculate. What emerged wasn’t just a chart or a graph, it felt like a symphony written in circles, color, and quiet rhythm.
A Little Love Letter to Pi
Let’s pause for a moment, not to crunch numbers, but to marvel.
Pi (π) is the ratio of a circle’s circumference to its diameter. Simple enough, right? Roughly 3.14. But here’s the magic: go further. Keep going. Past 3.14159… past 3.1415926535… and you’ll never hit repetition. Never. It goes on forever, irregular, unpredictable, a decimal ocean with no shores.
No fraction captures it. No pattern tames it. And yet, we keep chasing it. Trillions of digits computed. Not because we need them… but because we’re curious. Because there’s something deeply human in wanting to understand the infinite.
And then there’s Pi Day, March 14th. A delightful excuse to eat pie, share fun facts, and celebrate the quiet wonder hiding in plain sight. Who knew a number could bring people together like this?
My Creative Experiment: Turning Digits Into Dance
So I asked myself: What if we gave each digit of pi a voice, and a face?
I wrote a simple Python script (yes, even code can be poetic), fed it the first 10,000 digits, and let it paint.
Each digit became a circle.
Its color? Determined by its value, from soft blues (0) to deep purples (9).
Its size? Gently pulsing, growing slightly whenever the digit changed from the one before it.
Its place? Laid out in neat rows, like pages of an ancient book, left to right, top to bottom.
Here’s the heart of it:
import matplotlib.pyplot as plt

# Load the first 10,000 digits of pi from a file
with open('pi_digits.txt', 'r') as f:
    pi_digits = f.read().strip()[:10000]

# Initialize lists for positions, sizes, and colors
x, y, size, color = [], [], [], []

# Set up the plot
fig, ax = plt.subplots(figsize=(12, 12))

# Loop through each digit and generate visual properties
for i, digit in enumerate(pi_digits):
    if i == 0:
        x.append(0)
        y.append(0)
        size.append(50)
        color.append(int(digit) / 9)
    else:
        if digit != pi_digits[i - 1]:
            size[-1] = 50 + 5 * int(digit)
        x.append(i % 100)
        y.append(i // 100)
        size.append(50)
        color.append(int(digit) / 9)

# Plot the visualization
ax.scatter(x, y, s=size, c=color, cmap='gnuplot')
ax.axis('off')
ax.set_aspect('equal')
plt.show()